Total Population
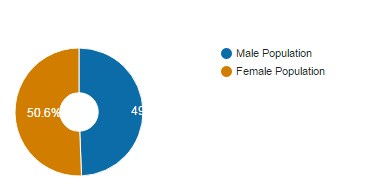
Male Population
Female Population
Percent Change Since 2000
Percent Change Since 2010
Median Age
Male Population
Female Population
Percent Change Since 2000
Percent Change Since 2010
Median Age
7,265
(49.4 %)
3,587
(50.6 %)
3,678
23.9 %
1.3 %
42.98
(49.4 %)
3,587
(50.6 %)
3,678
23.9 %
1.3 %
42.98
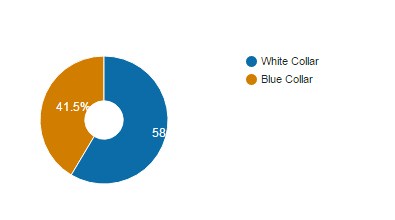
Employment
White Collar
Blue Collar
Blue Collar
1,089
771
771
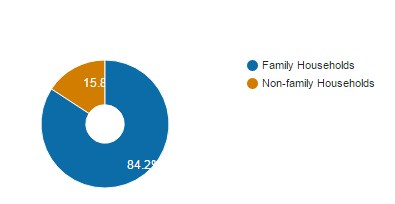
Households
Total Households
Family Households
Non-family Households
Households With Children
Households Without Children
Average People Per Household
Family Households
Non-family Households
Households With Children
Households Without Children
Average People Per Household
2,557
2,153
404
1,006
1,550
2.84
2,153
404
1,006
1,550
2.84
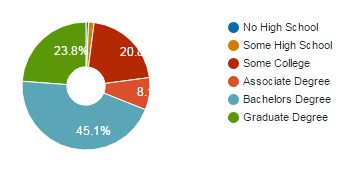
Education (Number of people who have achieved the following levels of education)
No High School
Some High School
Some College
Associate Degree
Bachelors Degree
Graduate Degree
Some High School
Some College
Associate Degree
Bachelors Degree
Graduate Degree
28
61
908
355
1,966
1,038
61
908
355
1,966
1,038
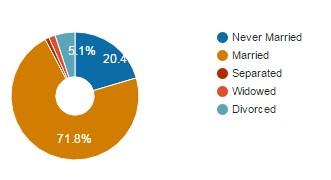
Marital Status (Number of people who have the following marital status)
Never Married
Married
Separated
Widowed
Divorced
Married
Separated
Widowed
Divorced
1,044
3,670
52
84
259
3,670
52
84
259
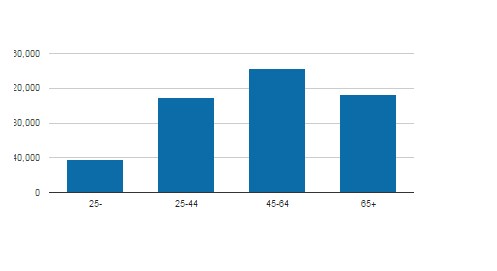
Income/Financial
Average Household Income
Median Household Income
Median Income Under 25
Median Income 25-44
Median Income 45-64
Median Income Over 65
Percent Increase/Decrease in Income Since 2000
Percent Increase/Decrease in Income Since 2010
Average Household Net Worth
Median Home Sale Price
Sales Tax Rate
Sales Tax Type
Average Household Total Expenditure
$160,366
$134,188
$37,500
$109,211
$142,587
$112,500
42.0 %
11.0 %
$1,147,421
$430,235
4.5 %
CO
$98,333
$134,188
$37,500
$109,211
$142,587
$112,500
42.0 %
11.0 %
$1,147,421
$430,235
4.5 %
CO
$98,333
Weather
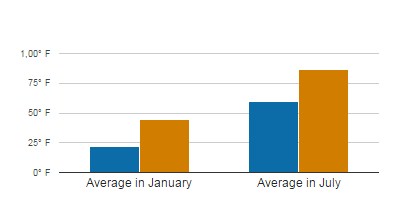
Average High in January
Average Low in January
Average High in July
Average Low in July
Annual Precipitation
Air Pollution Index
Average Low in January
Average High in July
Average Low in July
Annual Precipitation
Air Pollution Index
44.30 °F
22.00 °F
86.70 °F
59.50 °F
83.22 in.
92
22.00 °F
86.70 °F
59.50 °F
83.22 in.
92
Other Amenities
Airport
Miles To Airport
Junior College
Miles To Junior College
University
Miles To University
Sports Team
Miles To Sports Team
Miles To Airport
Junior College
Miles To Junior College
University
Miles To University
Sports Team
Miles To Sports Team
Denver International
28
REDSTONE COLLEGE-DENVER
5
COLORADO SCHOOL OF MINES
8
Colorado Avalanche
13
28
REDSTONE COLLEGE-DENVER
5
COLORADO SCHOOL OF MINES
8
Colorado Avalanche
13
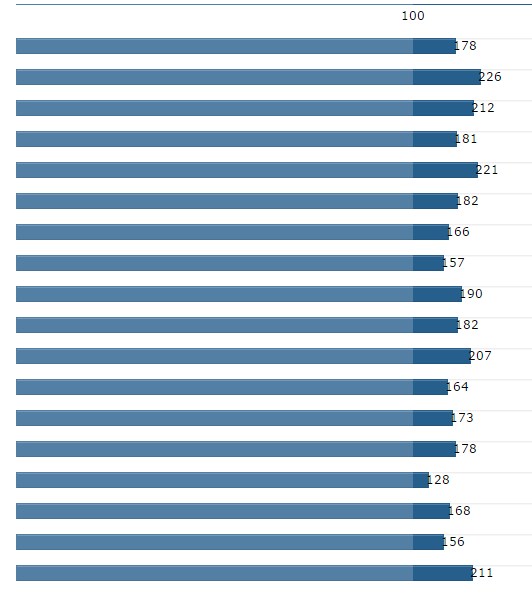
Lifestyle
The following values are represented as an index, where the value 100 represents the national average.
?
Total Household Expenditure
Contributions
Insurance
Clothing
Education
Entertainment
Food
Healthcare
Household Furnishings
Shelter
Household Operations
Other
Personal Care
Reading
Tobacco
Transportation
Utilities
Gifts
Below Average

Above Average
Crime
The following values are represented as an index, where the value 100 represents the national average.
?
Total Crime Risk
Personal Crime Risk
Murder Risk
Rape Risk
Robbery Risk
Assault Risk
Property Crime Risk
Burglary Risk
Larceny Risk
Automotive Theft Risk
Below Average
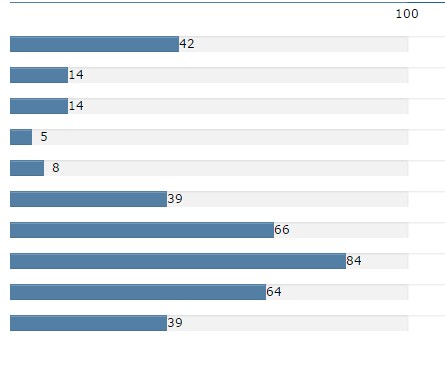

Above Average
Data on community demographi?cs provided by OnBoard LLC Copyright © OnBoard LLC. Informatio?n is deemed reliable but is not guaranteed?. All community demographi?cs data is for the year 2013 unless otherwise specified.?


 303.441.5642